Chapter 0

The Land Itself

Prologue · Deep time on the ridge and the spit

The Hook is the Highlands, rearranged.

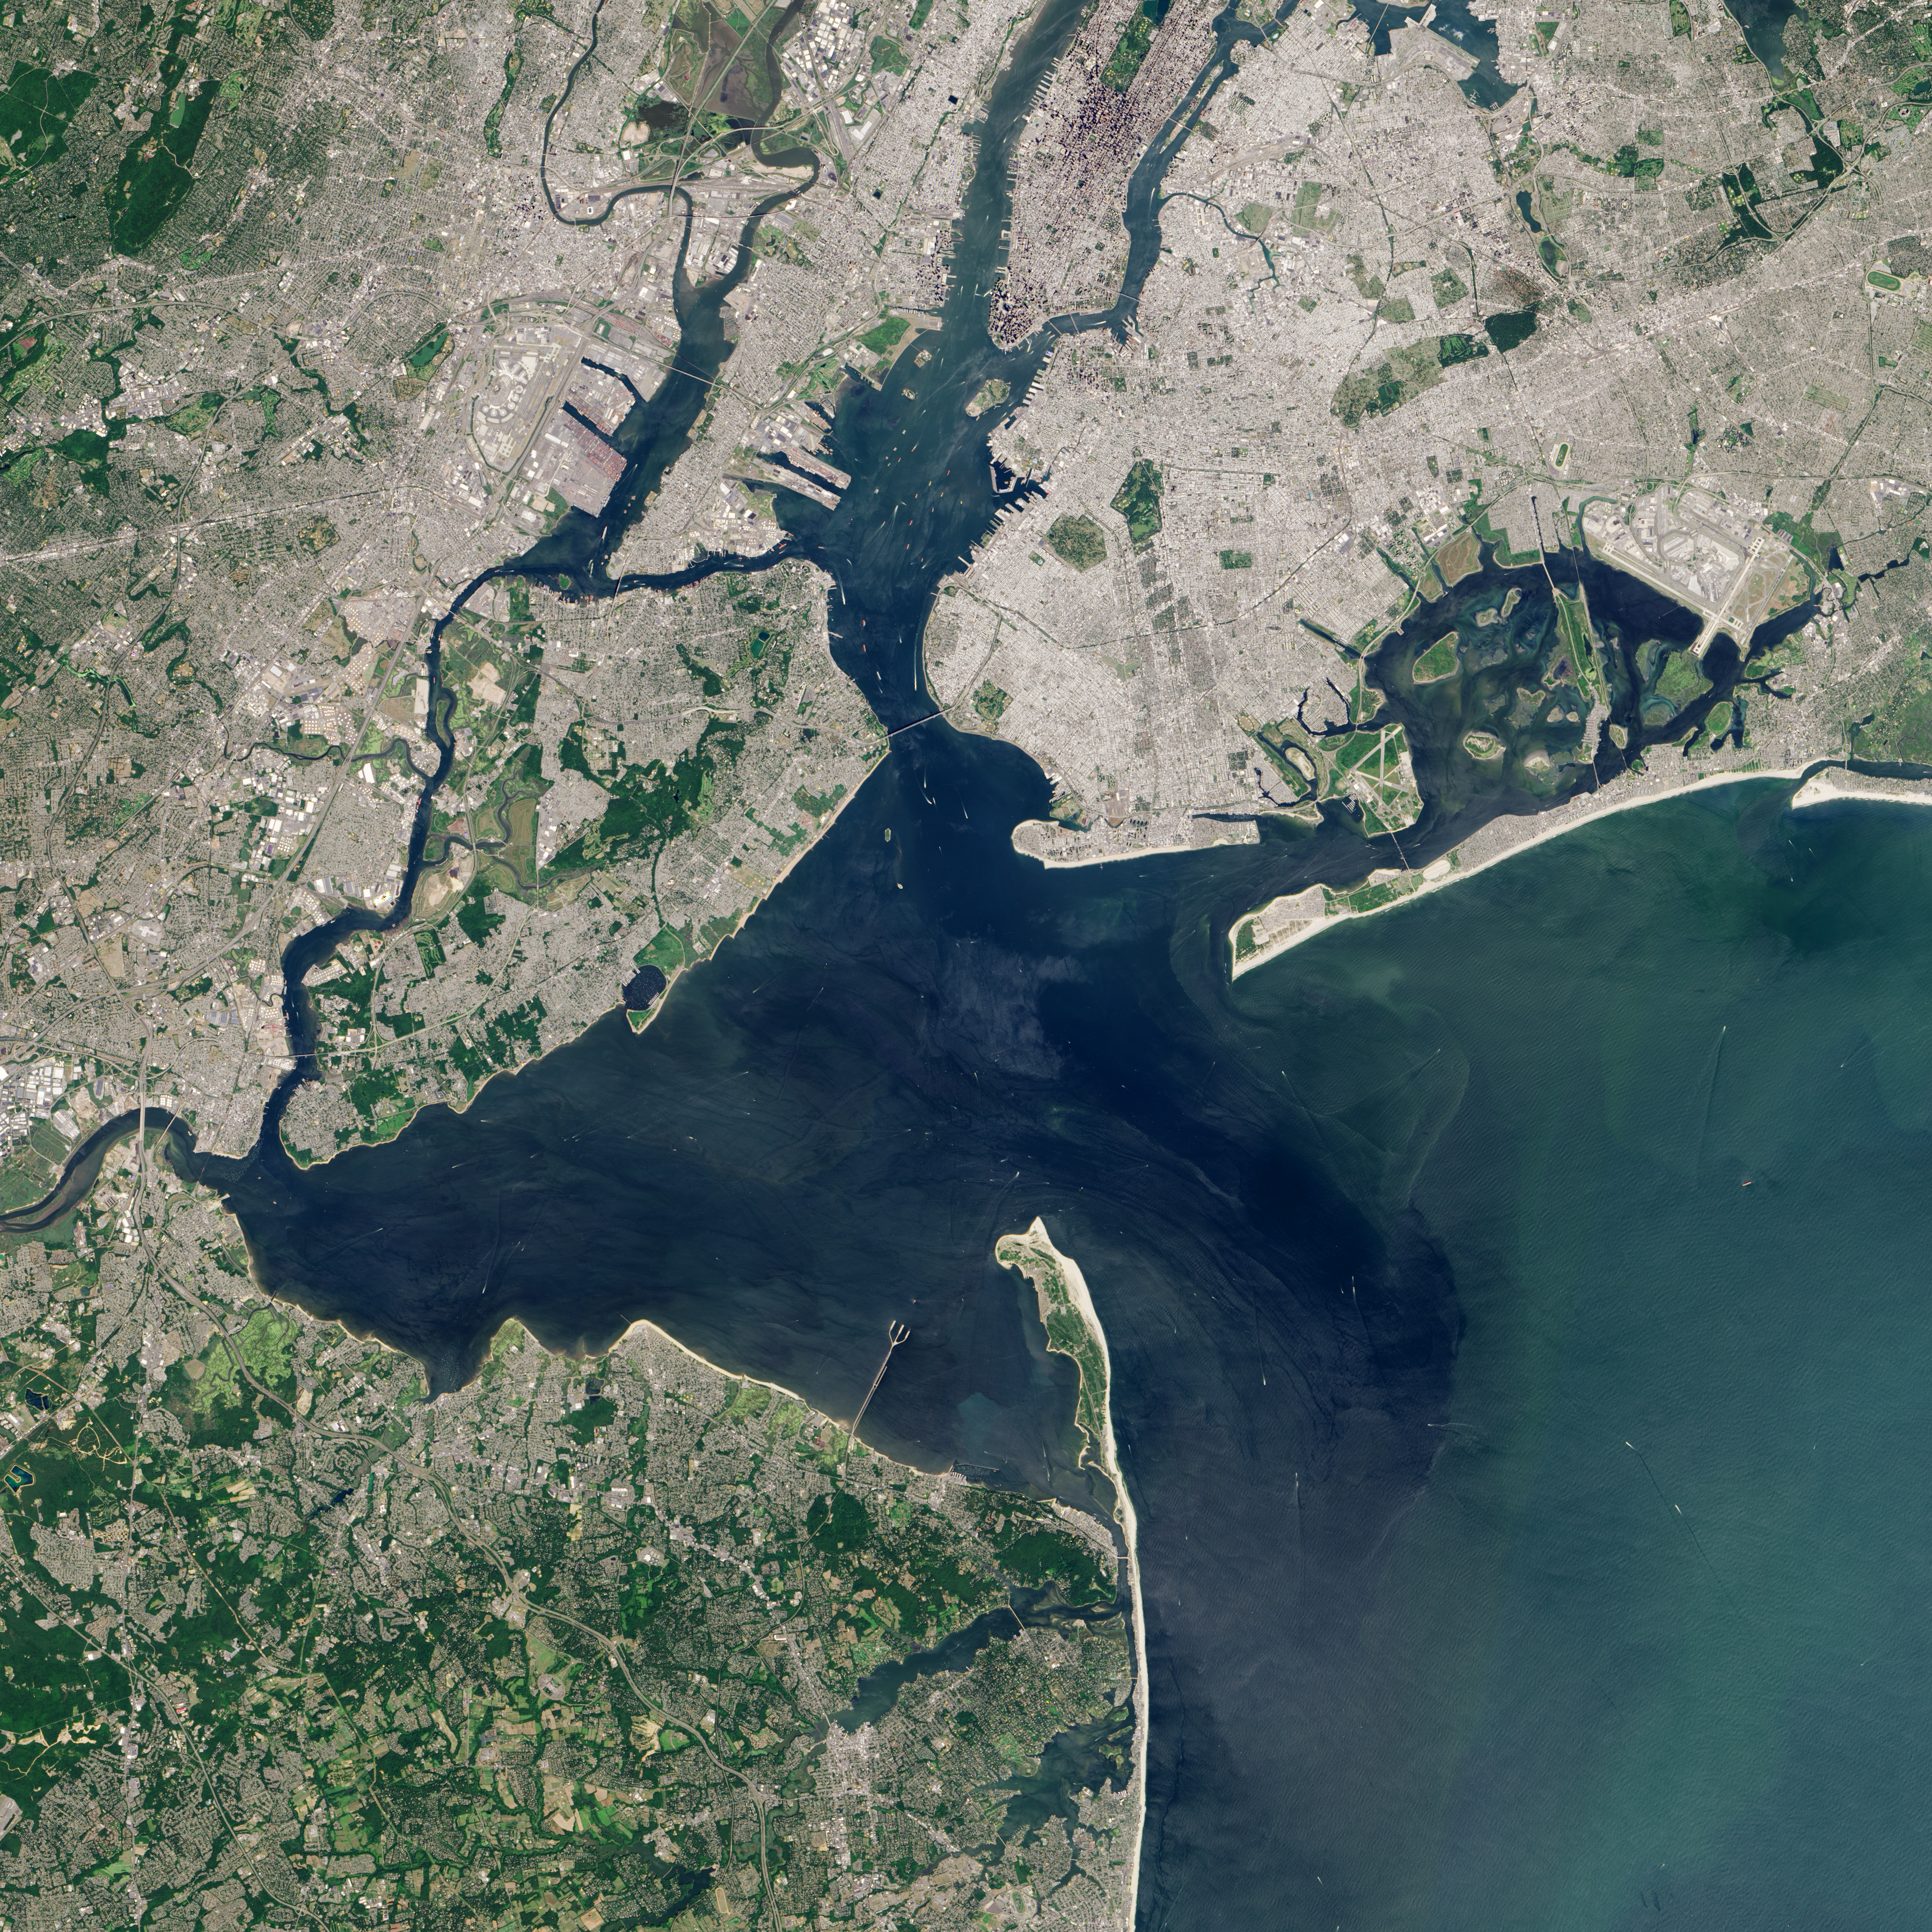
A Landsat 8 view of Sandy Hook and the Navesink Highlands, 26 August 2015 — the peninsula from tip to Highlands ridge, with the Navesink and Shrewsbury river mouths between

NASA Earth Observatory · Landsat 8 OLI · Jesse Allen · 2015-08-26 · public domain (NASA / USGS)

Stand on the summit of Mount Mitchill at first light. Behind you, the Navesink River. In front of you, the Atlantic. Between the two, a peninsula of pale sand that runs six miles north into the mouth of New York Harbor and stops at the harbor's throat — the lights of Coney Island and the Rockaways visible across the water.

The peninsula is Sandy Hook. The ridge you're standing on is the Navesink Highlands. The sentence to hold in mind while everything else gets explained is this: the Hook is the Highlands, rearranged.

Every grain of sand on the Hook was once a piece of stone in the ridge. The two features look like different things because they are in different states of motion. The ridge is stone standing still. The Hook is that stone, ground down and carried north by the sea, still moving, still growing at a rate you can measure against the lighthouse. Both are the same body of rock.

The height under your boots is not incidental. At 266 feet above mean sea level, Mount Mitchill is the highest natural point on the Atlantic seaboard between southern Maine and the Yucatán Peninsula — a claim precise enough that it does not conflate this seaboard headland with Crawford Hill's 391 feet in the inland part of Monmouth County. The height is why ships have found this coast for four hundred years. It is why the Dutch and English and French mapped the Highlands before they mapped almost anything else on this shore. It is why the U.S. Army built Fort Hancock at the foot of it and why the National Park Service watches it now.

Everything else in this chapter is downstream of the ridge and the sand.
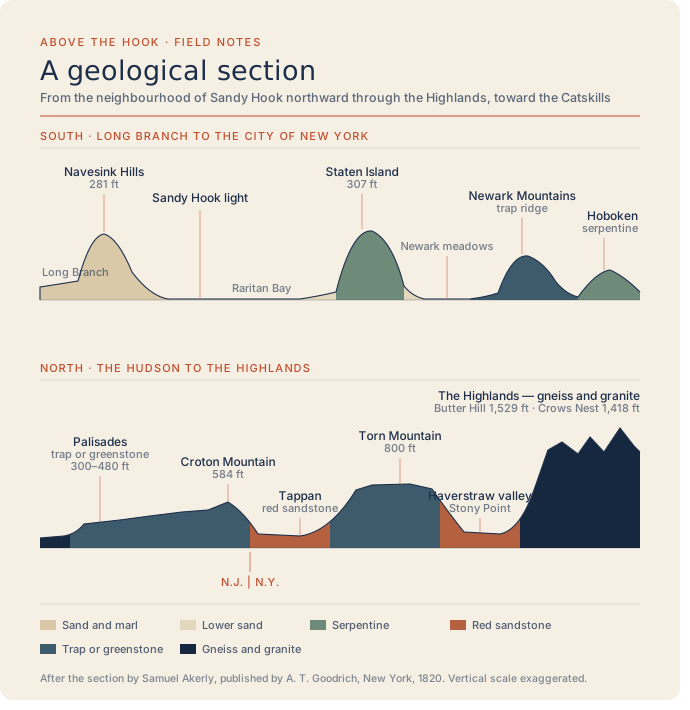
The Navesink Formation is the rock under your feet. It is a glauconite-rich marl — a "greensand," to the working geologist — deposited on a shallow sea floor in the late Cretaceous, roughly seventy to sixty-six million years ago. It is soft as stone goes; a coin will scratch it. It is packed with the fossil remains of animals that lived when this ground was ocean and the ocean was tropical.

The formation records the final chapter of the age of dinosaurs. That is not a poetic gesture. Belemnite guards, oyster shells, scaphopods, ammonites, and the occasional mosasaur tooth all appear in the marl in numbers a careful walker at low tide can pick up from the beach cobble at the base of the Highlands bluff. The bed dates from the Maastrichtian — the last stage of the Cretaceous — which is to say the very last million years or two before the impact event that ended the non-avian dinosaur world. The Highlands ridge is the last coherent piece of that ocean floor still holding above sea level at the New York bight.

One boundary carefully, one boundary precisely: the Highlands greensand is Maastrichtian, so it predates the K-Pg extinction boundary; the boundary itself is placed in New Jersey stratigraphy in the Hornerstown Formation that lies above the Navesink, and the boundary interval is studied inland at sites such as the Rowan University Fossil Park in Mantua Township and the Inversand pit before it. Do not read this ridge as "the day the dinosaurs died." Read it as "the last million years before."

If picking up a seventy-million-year-old belemnite guard is a thing you would like to do this weekend, the closest and most reliable places in New Jersey are Big Brook Preserve in Marlboro (Monmouth County Park System) and the Poricy Brook Fossil Beds in Middletown Township (Poricy Park). Both are public, both have parking, both are within a half-hour of the bluff.

STRATIGRAPHIC COLUMN · SCHEMATIC — THICKNESS NOT TO SCALE Paleocene 66.0 Ma ≈ 69 Ma ≈ 72 Ma AGE — MILLIONS OF YEARS younger beds, eroded from the ridge older Cretaceous beds continue below Hornerstown Formation EARLY PALEOCENE · GLAUCONITIC SAND K–PG BOUNDARY · THE EXTINCTION placed above the Navesink, in the Hornerstown Navesink Formation MAASTRICHTIAN · GREENSAND MARL the rock of the Highlands bluff — the last million years of the age of dinosaurs Mount Laurel Formation CAMPANIAN · QUARTZ SAND Schematic after NJ Geological Survey stratigraphy of the Atlantic Coastal Plain · drawn by Above the Hook
Schematic after NJ Geological Survey stratigraphy of the Atlantic Coastal Plain · drawn by Above the Hook.

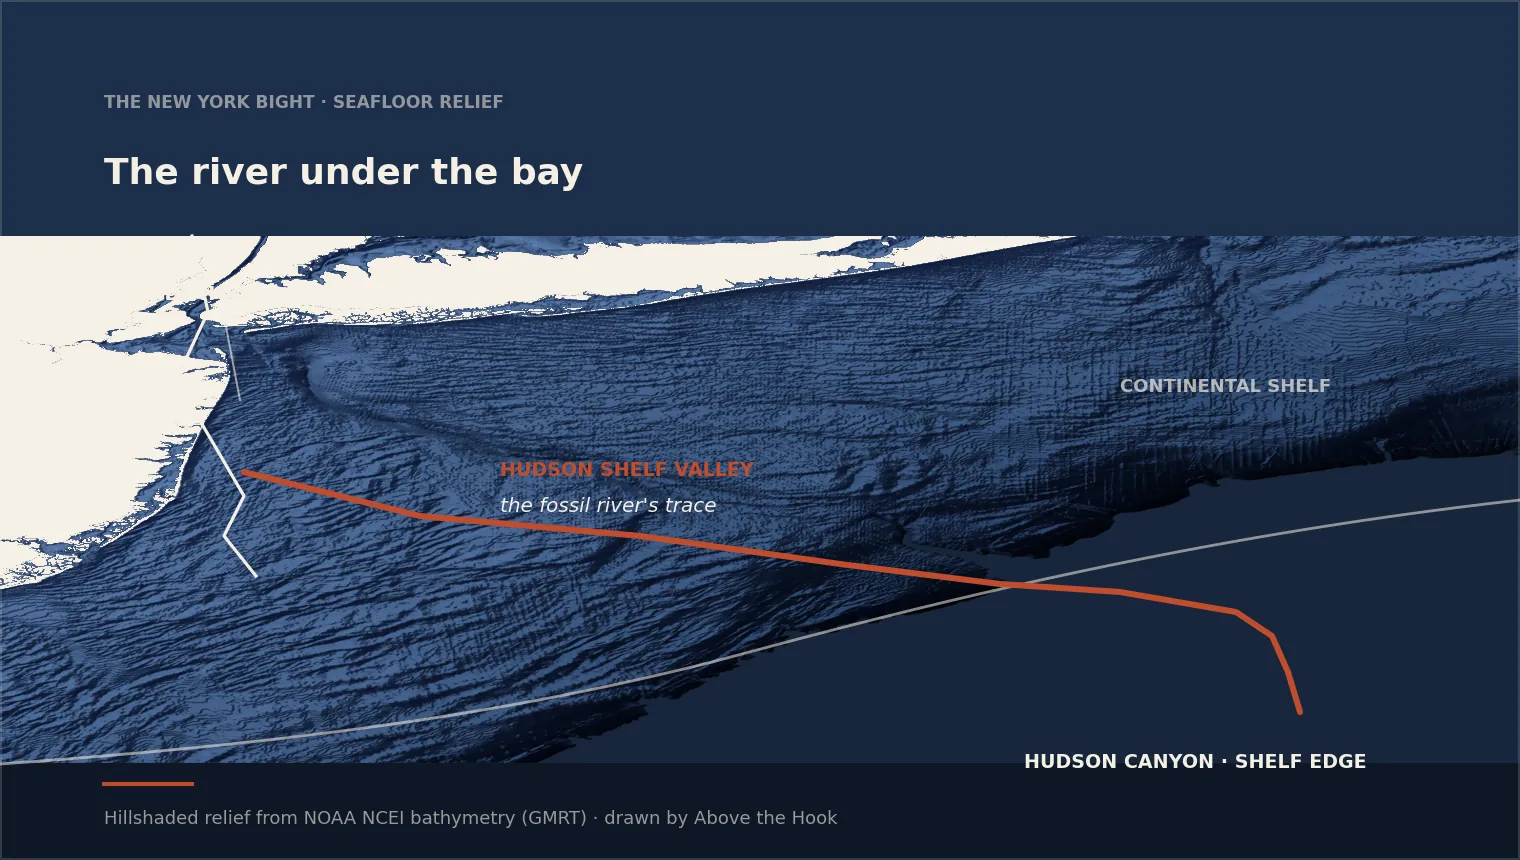
Look at a bathymetric chart of the New York Bight and you will see a channel, running east from the mouth of the Hudson River, crossing the continental shelf, cutting through the outer edge of the shelf, and dropping into the deep water beyond.[1] The channel is not modern. It is a fossil river.

Between roughly twenty-six thousand and eighteen thousand years ago, at the peak of the last glaciation, the Laurentide Ice Sheet reached its terminal moraine at what is now the northern shore of Long Island and Staten Island. Sea level stood approximately one hundred and twenty meters — about four hundred feet — lower than today. The coast of North America ran roughly eighty miles east of the modern shoreline. And the Hudson River carried meltwater from the retreating ice across the exposed continental shelf and spilled it into the ancestral Atlantic through a channel it had cut into the shelf itself. That channel — the Hudson Shelf Valley on modern charts — is the river's fossil trace. It runs from Sandy Hook to the Hudson Canyon, where it drops off the shelf edge.

When the ice retreated and sea level rose, that channel drowned. What the maps call New York Harbor is a drowned river mouth: the ancestral Hudson's valley, with the modern harbor at its head. This is the geological content of the chapter's section title. The Hook stands at the seaward end of that drowned valley, which is the reason the harbor is a harbor and the reason ships have been arriving here since Verrazzano's Dauphine in fifteen twenty-four.

A dark-panel bathymetric relief of the New York Bight — the continental shelf as a broad mid-navy band, the shelf edge dropping toward darker navy at the right, and a rust polyline tracing the Hudson Shelf Valley from off Sandy Hook east across the shelf to the head of the Hudson Canyon.
Hillshaded relief from NOAA NCEI bathymetry · Hudson Shelf Valley in rust · drawn by Above the Hook.

The Hook itself is a recurved sand spit. Sand eroded from the Jersey Coastal Plain to the south — from the Cretaceous marls and later formations, ground down over the last ten thousand years — is carried north by the alongshore current that runs the whole New Jersey coast. That current bypasses the resort towns, bypasses the base of the Highlands ridge, and drops its load at the north tip of the Hook. This process is currently building the Hook northward at roughly three feet per year — an average that hides a lot of local variation and a lot of storm work, but the multi-century trend is real and measurable.

The measuring rod for this whole story is the Sandy Hook Lighthouse, built in 1764 by New York merchants — the oldest continuously operating lighthouse in the United States, and the third feature-of-record on the peninsula after the ridge and the spit.Sandy Hook Lighthouse1764 When it was lit for the first time on the eleventh of June, seventeen sixty-four, it stood roughly five hundred feet from the tip. By its centennial in 1864, the tip had grown most of a mile past the light. Today the tip stands well over a mile past the light. The lighthouse has not moved. Everything on the map north of it has grown, one grain of sand at a time, over the past two hundred and sixty years.[2]

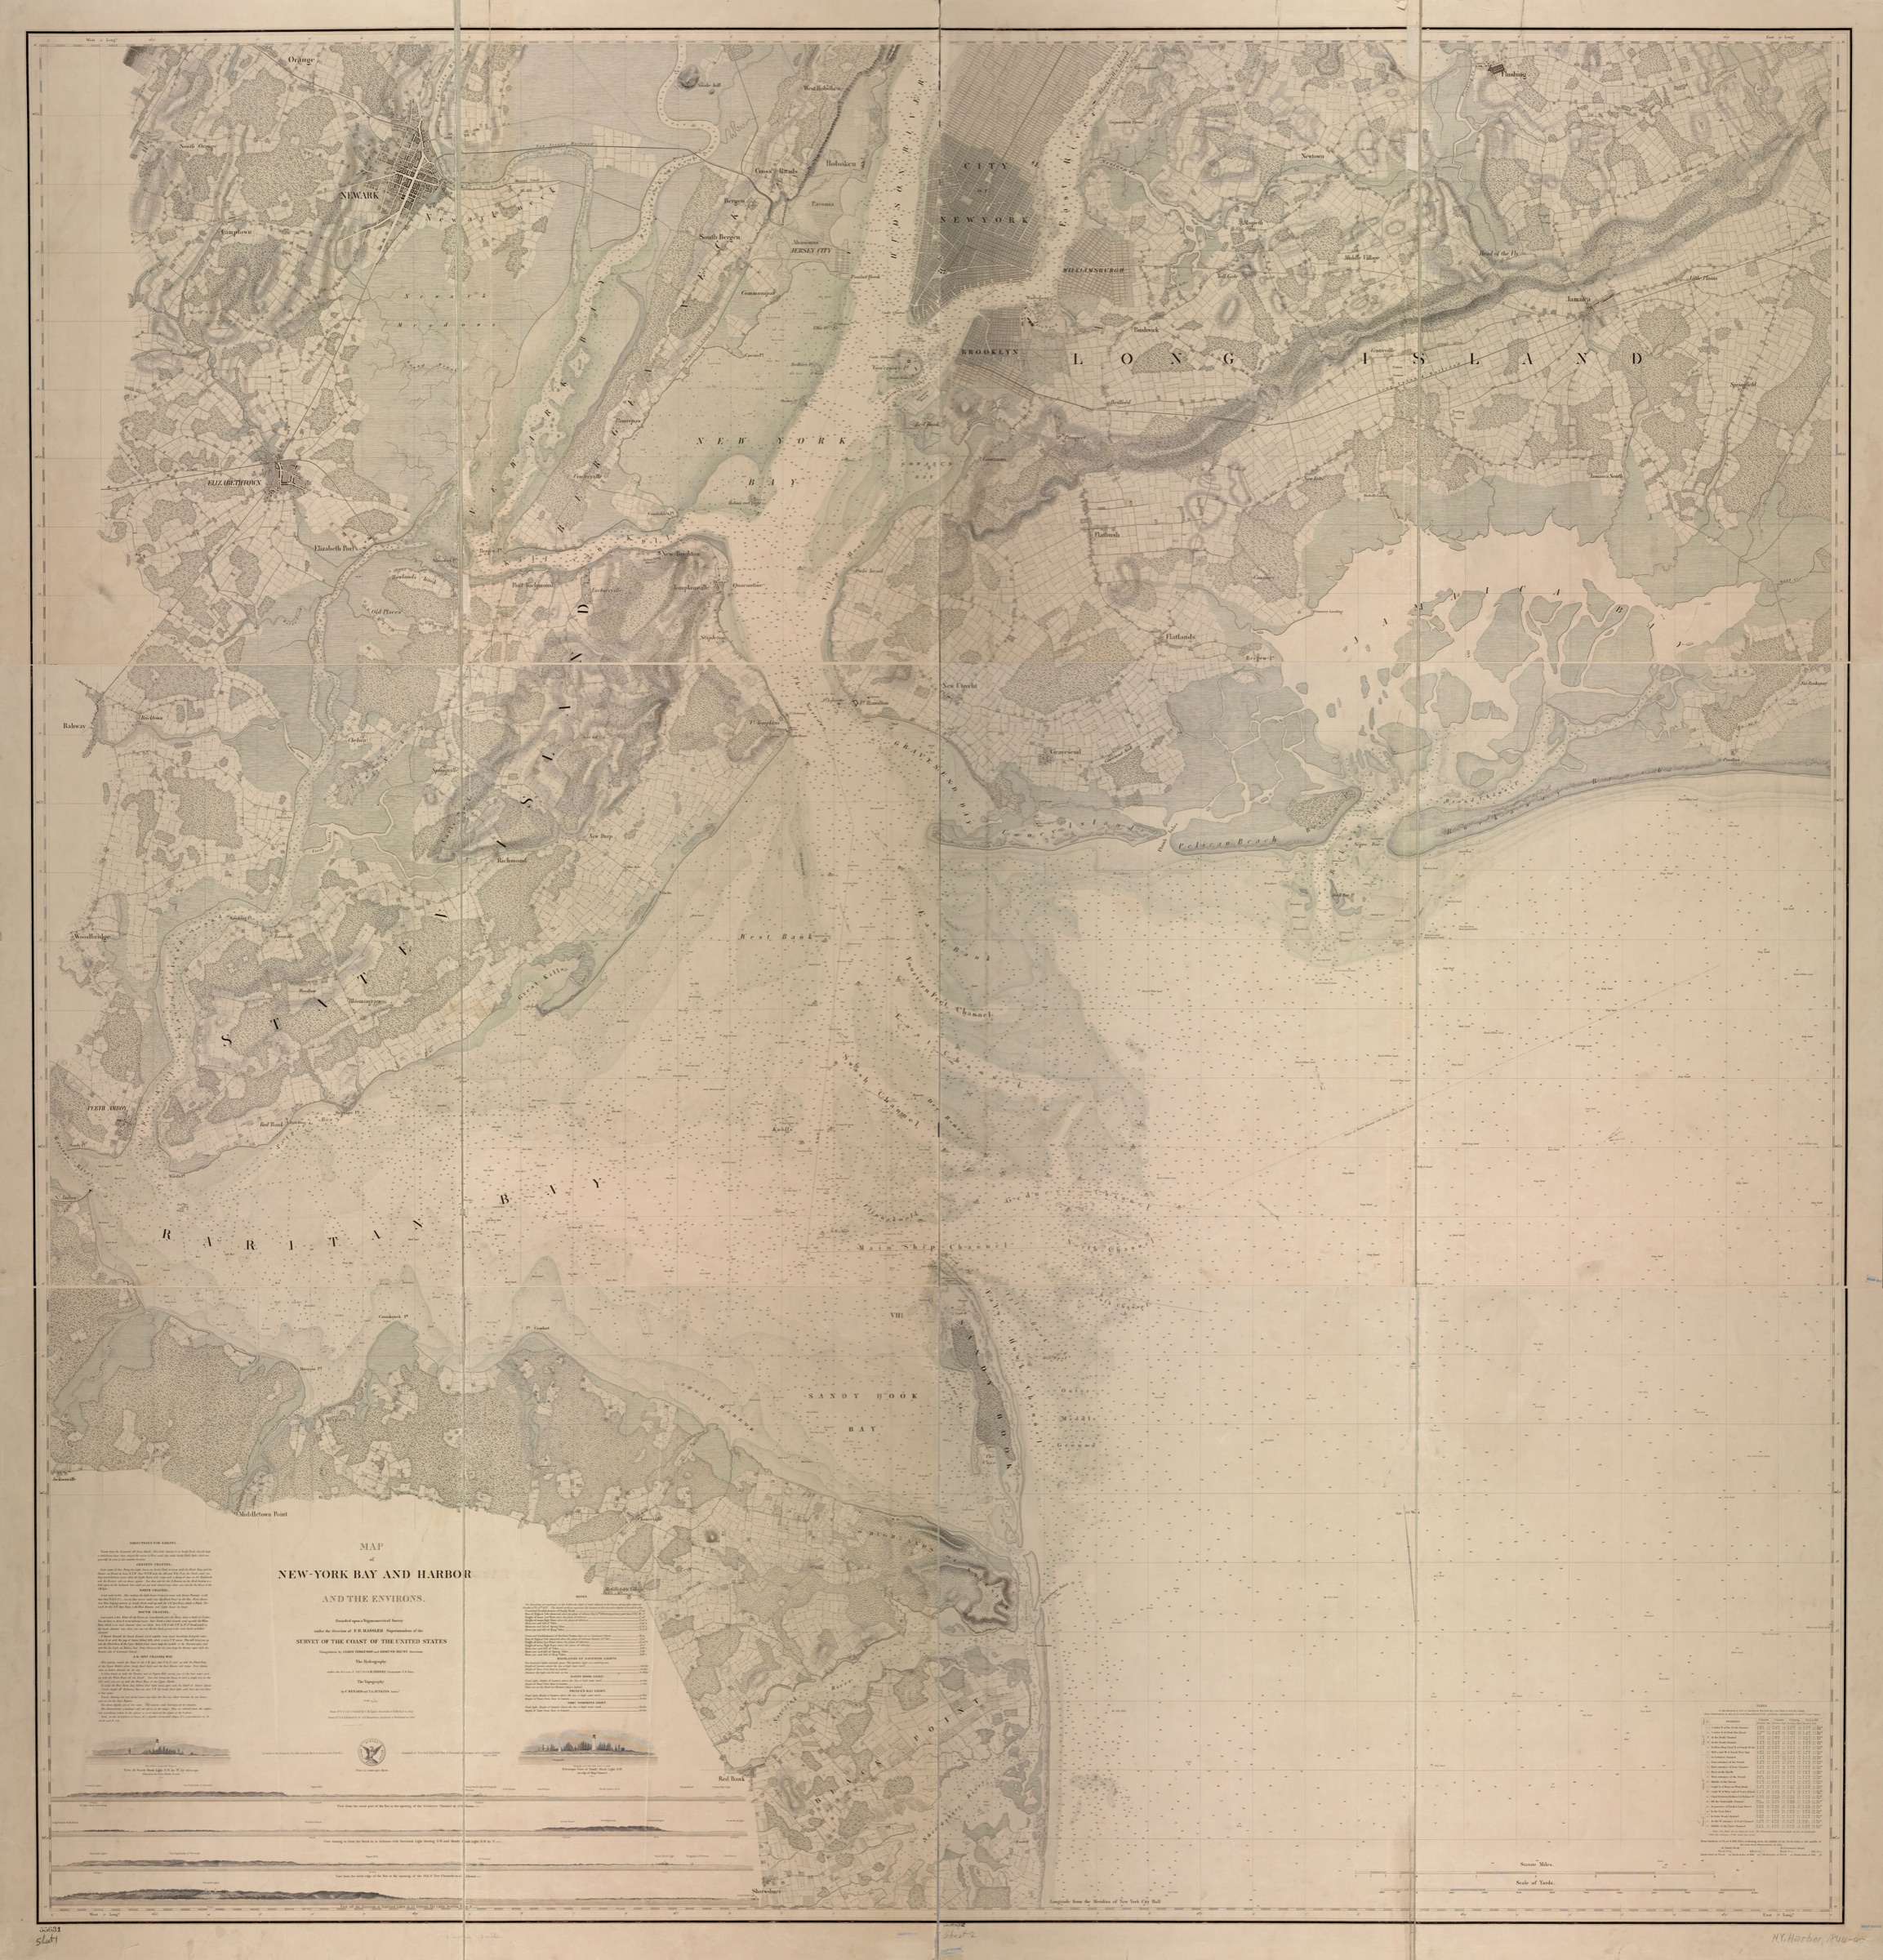
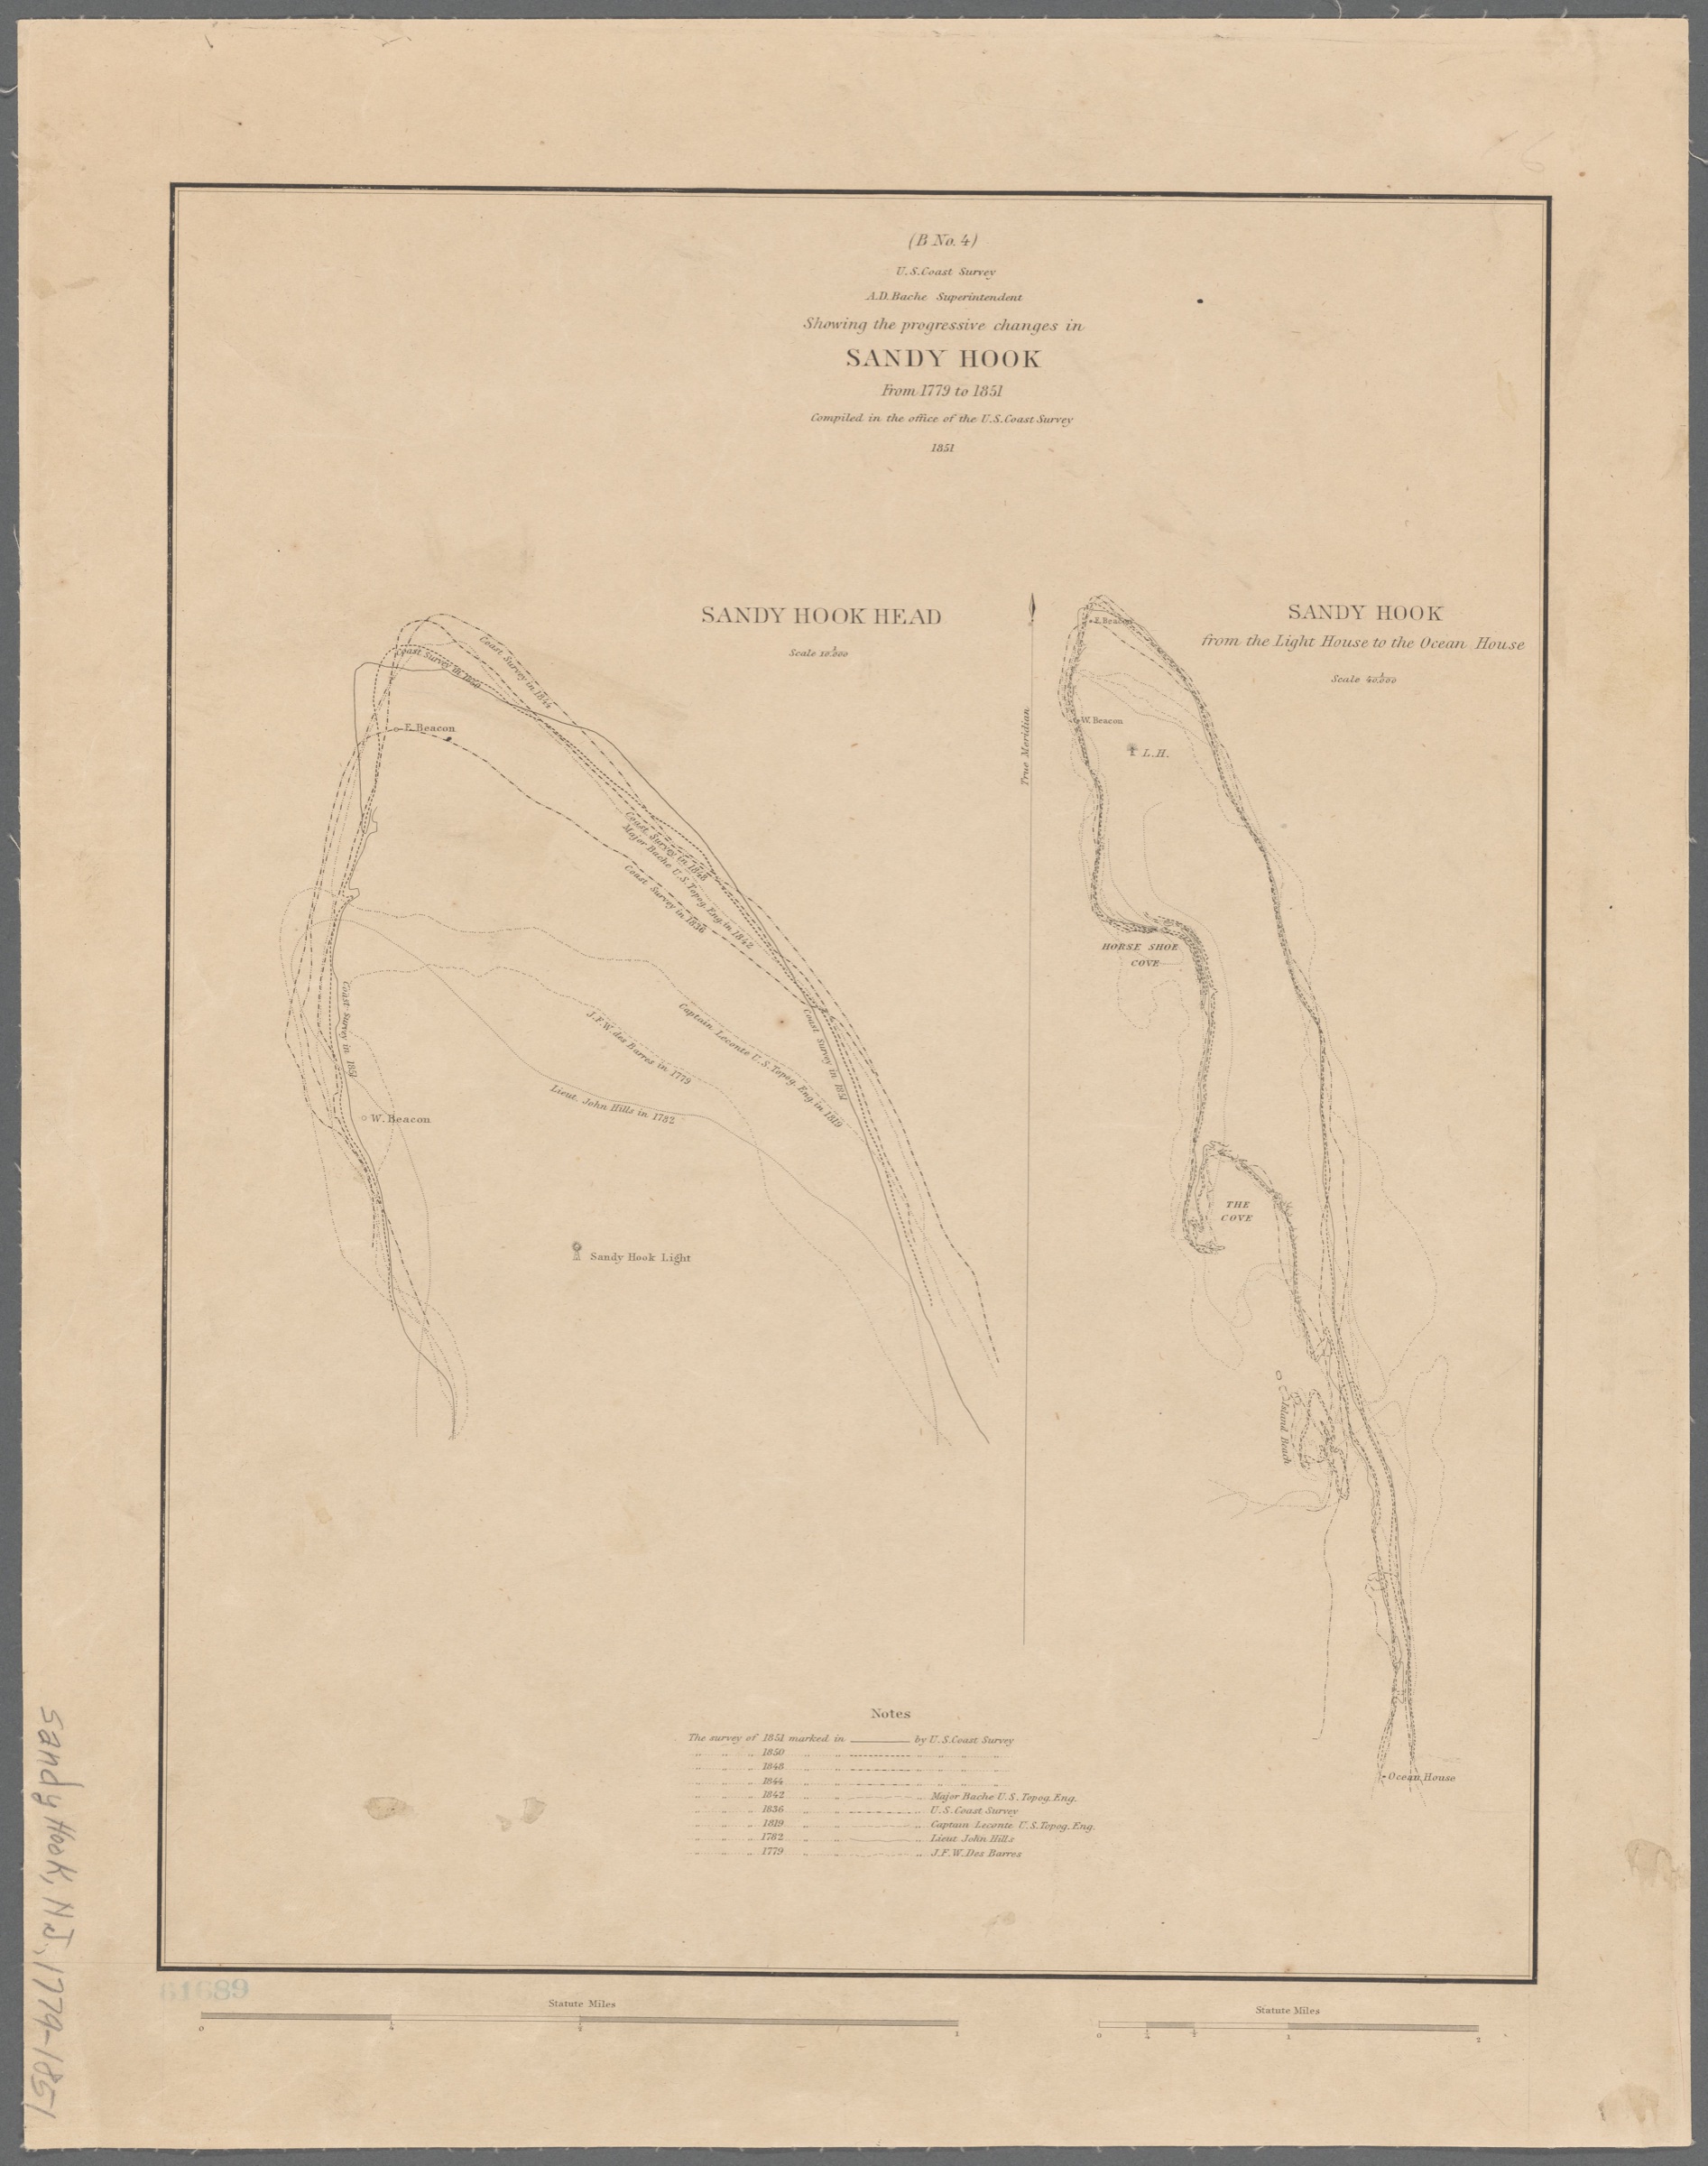
The first instrumental measurement of the tip's position landed on paper in 1845, when the U.S. Coast Survey drew Sandy Hook for the first federal chart of the New York Harbor approaches.U.S. Coast Survey chart of Sandy Hook, 18451845 Every subsequent edition — 1893, mid-century, today — has redrawn the peninsula a little further north.

The growth of the spit does not only add sand at the north end. It also redirects rivers. The Navesink and Shrewsbury — both of which once emptied directly into the Atlantic through the southern base of the Hook — are today walled off from the ocean by a lengthening spit and flow north inside the Hook, meeting Sandy Hook Bay near Highlands. They flow the way they flow because the sand has said so.

Return to the thesis. The sand that built the Hook is the Highlands, ground down and moved. The greensand at the base of the bluff is the marl the sea deposited seventy million years ago. The sand on the beach north of the lighthouse is that same marl and later material, disaggregated and put back into motion by longshore drift. The two features are the same body of rock in two different tenses.

Enter the object · 1845 U.S. Coast Survey chart of Sandy Hook

A schematic representation of an 1845 U.S. Coast Survey nautical chart of Sandy Hook — cream paper with a rust compass rose and navy coastline sketched in the site's brand palette
The 1845 U.S. Coast Survey chart of Sandy Hook — the first federal chart used in this chapter's growth timeline. Pan and zoom the object; the archive detail page holds the full record.
Sandy Hook spit growth · four moments A schematic ruler with the 1764 Sandy Hook Lighthouse fixed as a small navy tower. Four overlaid states show the peninsula tip walking progressively further north past the lighthouse — 1845, 1893, mid-century, and today. Only the current state is fully visible; the scrolly runtime updates the current state as the reader scrolls. SANDY HOOK · THE TIP WALKS NORTHN THE HIGHLANDS SANDY HOOK LIGHT · 1764it has never movedSchematic after NPS Shifting Sands of Sandy Hook · drawn by Above the Hook 1845THE TIPthe tip is around half a mile past the light 1893THE TIPmost of a mile past the light mid-centuryTHE TIPpast a mile, curling west TODAYTHE TIPwell over a mile past the light
Schematic after NPS Shifting Sands of Sandy Hook · drawn by Above the Hook.

1845

The U.S. Coast Survey commits the peninsula to a chart for the first time. Eighty-one years after the lighthouse was lit, the tip has already walked most of the way to half a mile past the light.

1893

William Sandlass takes the lease on four lots at Highland Beach. By the time his bath houses open, the tip is most of a mile past the lighthouse; the resort is inside the spit's own working geometry.

Mid-century

The Improvement Company is gone, the Army holds the north end, and the tip has walked past a mile. The lighthouse has not moved. Everything on the map north of it is younger than the lighthouse.

Today

The tip stands well over a mile past the light. The growth is still happening — a few feet a year, hidden inside the daily surf, showing up on the charts every time the U.S. Coast Survey redraws the coast.

THE LIGHTHOUSE AS RULER · SCHEMATIC — DISTANCES APPROXIMATESANDY HOOK LIGHT · BUILT 1764it has never moved1764500 feet from the tip1864most of a mile past the lightTODAYwell over a mile past the lightthe tip walks north — one grain at a timeSolid form: the spit at first lighting, 1764. Dashed: growth by 1864 and today · drawn by Above the Hook
Solid form · the spit at first lighting, 1764. Dashed · growth by 1864 and today. Drawn by Above the Hook.
THE CONVEYOR · LONGSHORE DRIFT — SCHEMATICMONMOUTH BLUFFS · THE SOURCEthe ridge, eroding grain by grainLONGSHORE CURRENTsand moves northTHE HOOK · DEPOSITIONthe tip curls west into the harborThe Highlands, in motionNSchematic after NPS Shifting Sands of Sandy Hook · drawn by Above the Hook
Schematic after NPS Shifting Sands of Sandy Hook · drawn by Above the Hook.

Read the previous four sections at the pace they need to be read: geological time is not the pace of a human paragraph. What follows now is a much shorter timescale. Human occupation of this coast begins in the millennia after the last ice retreated and continues today.

The Navesink Highlands and Sandy Hook are the ancestral homeland of the Navesink band of the Lenape — an Algonquian-speaking nation of the mid-Atlantic. Lenape communities lived along the bayshore, the ridges, and the peninsula for thousands of years before the first sail was recorded off this coast. Lenape nations continue to exist today. The Nanticoke Lenni-Lenape Nation of New Jersey, the Ramapough Lenape Nation, and the Sand Hill Indian Historical Society in Monmouth County are the community-authored sources this chapter follows on Lenape life. This chapter is written with, not about.

The 1524 landfall. In April of 1524, Giovanni da Verrazzano in La Dauphine becomes the first European to describe this coast. His letter to François I of France — the earliest surviving European written record of what would later be named Sandy Hook — records the bluff and the spit as geographic features but does not yet name the Navesink themselves.

The chart is silent about the people already living on the land it charts.

That silence is the first act of the colonial record.

The 1609 encounter. Eighty-five years later, in September 1609, Henry Hudson's Halve Maen anchors in Sandy Hook Bay under charter to the Dutch East India Company. Robert Juet's shipboard journal supplies the first English-language written description of the coast and the Navesink people who came out to meet the ship. The Halve Maen crew traded with the Navesink; one of them, John Colman, was killed in a skirmish on September 6, 1609, and by tradition buried on the Hook. His grave, if it exists, has not been found.

The 1664 deed. The English took New Netherland in 1664. Later that same year, colonial documents record a deed transferring the Navesink Highlands and Sandy Hook tract from Navesink sachems — Popamora among them — to English settlers. What the deed says the English understood themselves to have purchased is one thing. What the Navesink understood the transaction to be is not a question a colonial deed can answer. This project reports the deed and says so.

The chain. From the 1664 deed forward, the colonial legal record proceeds in a spare sequence: Popamora et al. → subsequent transfers → Richard Hartshorne's acquisitions in the Highlands and Sandy Hook (largely completed by the late 1670s). By 1678 Hartshorne holds most of what became Middletown Township. By 1806 his heirs will convey much of Sandy Hook to the federal government, which is a story for a later chapter. The chain of custody is a colonial construct laid over a Lenape presence that preceded it by millennia. Popamora Point in Highlands still carries the name.

The Navesink descendant communities named above are the people to consult for the fuller story of what the ridge and the spit have meant, and continue to mean, to Lenape families. Any substantive chapter about pre-1600 Navesink life waits for partnership with those communities.

Walk the North Beach access path at Sandy Hook and you enter a maritime holly forest — an Ilex opaca stand at the north end of the peninsula that is one of the finest examples of the community type on the Atlantic seaboard. Individual holly trees in the stand exceed a century and a half in age. Some may exceed two centuries. The stand as a stand has been documented on the site for well over a hundred years.

The reason the forest is intact is the reason so much of the Hook's ecology is intact: the peninsula was closed to the public for a century. The Army opened the Sandy Hook Proving Ground in 1874 and tested ordnance from it for the next two decades; in 1895 the post was designated Fort Hancock. The Army held the peninsula until December of 1974, when Fort Hancock closed; Gateway National Recreation Area had been authorized in 1972, and the transition placed the Hook inside the park. In the same century that comparable maritime hollies elsewhere on the Jersey Shore were cleared for hotels and cottages, the Sandy Hook stand was inside a fence. The forest survives, in short, because the twentieth century did not touch it.

The ecology of the peninsula is not only the holly forest. It is a Cape May cedar swamp on the wetter interior. It is the osprey pole at the north tip and the horseshoe crab spawning beaches on the bay side. It is the herring gulls, the least terns, the piping plovers. It is one of the more important songbird migration corridors on the eastern seaboard — the peninsula lies directly under the Atlantic flyway, and the holly stand acts as first landfall for birds crossing north after long overwater flights.

Sandy Hook is a young feature. A sixty-five-million-year old ridge is not. The section-title contrast is deliberate: the peninsula's youngest formative process (spit growth by longshore drift) runs on a clock a century wide, but the regional coastal geometry that made spit growth possible in the first place runs on a clock twenty thousand years wide. It is worth pausing on the deeper clock.

The Laurentide Ice Sheet — the great continental ice mass that covered most of Canada and the northern United States at the peak of the last glaciation — reached its terminal moraine at roughly the modern north shore of Long Island and Staten Island approximately twenty thousand years ago. Sandy Hook did not lie under the ice. It did lie in front of it, at the edge of an exposed continental shelf. Sea level at the glacial maximum stood approximately one hundred and twenty meters (about four hundred feet) lower than today; the coastline ran roughly eighty miles east of the modern shoreline. The land at what is now the Highlands ridge was inland from a much broader coastal plain.

From the last glacial maximum through the mid-Holocene — roughly twenty thousand to six thousand years ago — sea level rose by about a hundred and twenty meters as continental ice retreated and meltwater returned to the ocean.[3] The rate slowed markedly around six thousand years ago and has been comparatively modest since. The modern shoreline configuration — the drowned river mouth of New York Harbor, the position of Sandy Hook as a spit, the relationship between the ridge and the water — is essentially a Holocene feature. It is younger than the pyramids.

TWENTY THOUSAND YEARS AGO · THE LAST GLACIAL MAXIMUMLAURENTIDE ICE — FRONT AT THE LONG ISLAND MORAINEEXPOSED SHELF — DRY LANDthe coast ran ~80 miles east of today's shoreANCESTRAL HUDSONthe fossil river, cutting the shelf valleySHELF EDGE · THE CANYONMODERN SHORELINE (GHOST)Sea level: four hundred feet lowerSchematic — ice front, exposed shelf, and the ancestral Hudson at the glacial maximum · drawn by Above the Hook
Schematic — ice front, exposed shelf, and the ancestral Hudson at the glacial maximum · drawn by Above the Hook.

Since 1932, the U.S. Coast and Geodetic Survey — later NOAA — has operated a continuously-recording tide station at Sandy Hook (station 8531680). The station is the primary reference for sea-level trends in the New York Bight, and its record is one of the longer instrumental records on the American Atlantic coast.[4]

The trend across the record — a least-squares line fit to every monthly mean from 1932 through the current data pull — is about 4.3 millimeters per year. That's roughly a foot and a half per century, meaningfully higher than the global mean and reflecting regional subsidence in the New York Bight combined with Gulf Stream and North Atlantic circulation dynamics. The chart below the section shows the record itself; the trend line runs through the middle of it.[4]

On the twenty-ninth of October, 2012, Hurricane Sandy came ashore in southern New Jersey. Storm surge at the Sandy Hook station reached the highest instrumental value in the station's record. The USGS post-storm documentation for New Jersey — published as USGS Scientific Investigations Report 2016–5085, Suro, Deetz, and Hearn, Documentation and Hydrologic Analysis of Hurricane Sandy in New Jersey, October 29–30, 2012 — maps the surge extent across the state, including the flooded inland footprint at Highlands. The report is public and open-access.[5]

The chapter closes here, at the same shoreline where it opened. The instrument on the pier is the modern eye that watches the same water Verrazzano and Hudson watched, and the same water the Navesink watched before either of them. The height of the ridge made the coast a landmark; the growth of the spit made it a harbor; the fossil river beneath it made both things possible; the ice sheet at the maximum of the last glaciation drew the outer boundary that made the shoreline what it is; and the Lenape lived here, and live here, through all of that geological context and beyond it. The chapter's thesis returns one last time: the Hook is the Highlands, rearranged. The rock still in place is the ridge. The rock in motion is the sand. The story that follows is what happened on top of both.

People have been arriving ever since.

STATION 8531680 · SANDY HOOK — MONTHLY MEAN SEA LEVELThe water, measured.Linear trend across the record · 4.3 millimeters per year.FEET · STATION DATUM1932196019902026OCT 2012 · HURRICANE SANDYhighest monthly mean in the recordNOAA Tides & Currents, station 8531680 · drawn by Above the Hook
NOAA Tides & Currents, station 8531680 · drawn by Above the Hook.

Sources

  1. Global Multi-Resolution Topography · New York Bight grid. Marine Geoscience Data System (Lamont-Doherty) · federated with NOAA NCEI. Link Public-domain bathymetric grids fetched via the GMRT Grid Server for a 38.5–41°N, 71–74.5°W extent. Rendered as hillshaded relief with an editorial rust trace along the Hudson Shelf Valley's published thalweg.
  2. National Park Service. Shifting Sands of Sandy Hook. Gateway National Recreation Area, Sandy Hook Unit. Link NPS interpretive publication documenting the peninsula's littoral drift dynamics — the source for the 500 ft (1764), ¾ mile (1864), and 1½ mile (today) figures for the tip's distance from the Sandy Hook Lighthouse.
  3. How does present glacier extent and sea level compare to the Last Glacial Maximum?. U.S. Geological Survey. Link USGS reference for the ~120 m / ~400 ft sea-level drop at the Last Glacial Maximum.
  4. Sea Level Trends · Sandy Hook, NJ (Station 8531680). NOAA Tides & Currents. Link Continuously-recording tide station since 1932; published mean sea level trend of 4.12 mm/yr (±0.20 mm/yr, 95% confidence) computed on the 1932–onward monthly-mean record.
  5. Thomas P. Suro & Anna Deetz & Paul Hearn. Documentation and Hydrologic Analysis of Hurricane Sandy in New Jersey, October 29–30, 2012. U.S. Geological Survey · Scientific Investigations Report 2016–5085. 2016. Link Prepared in cooperation with FEMA; maps the storm-tide elevations and flooded inland footprint across New Jersey, including Highlands.